or start from open source methods. Learn more about OneLab softwareUse OneLab
QSC Fluorescent Antibody Titration
This example method provides a freely adjustable framework for measuring the adaptability of the OneLab environment to workflows from different application fields. It helps to understand various nuances of the code-free, universal protocol designer and provides general indications as to the feasibility of a project. Scripts generally require fine adjustment to correct for variables and support specific labware implementation.
Overview
Flow cytometry is a valuable tool to identify and measure the number of cells with specific immunophenotypes in a heterogeneous cell population as well as to estimate expression levels of specific intracellular molecules or antigens expressed on the cell surface, such as receptors. Mapping the density of specific cell-surface receptors and the study of their molecular interaction provides insights into the understanding of cellular behavior and biological function. The knowledge gained will ultimately help screening and developing novel therapeutic agents.
A well-established and simple method to quantitate the number of receptors on cells is to use calibrated beads stained with quantifiable amounts of fluorophore-conjugated monoclonal antibody (mAb) that target the receptor of interest. The generated calibration curve relates the fluorescence value of beads to their antibody binding capacity (ABC). Cell samples labeled with the same fluorophore-conjugated mAb are then analyzed using the same settings of the flow cytometer and their fluorescence value is recorded. Using the standard curve, an ABC value is assigned to each cell population based on its measured fluorescence value.
QuantumTM Simply Cellular® Microspheres for ABC Determination
QuantumTM Simply Cellular® (QSC) microspheres (~ 6 - 9 μm in diameter) are used as external standards to measure the level of expression of receptors on cells. QSC Microspheres are labeled with the same fluorophore-conjugated monoclonal IgG antibody used to stain cells. QSC kits consist of a series of five microsphere populations: one uncoated blank and four coated with increasing amounts of Fc-specific capture antibody. Each kit is designed to specifically bind antibodies according to the host species from which they derive (e.g. QSC anti-Mouse IgG, QSC anti-human IgG, and QSC anti-rat IgG). For example, the QSC anti-Mouse kit is intended to bind mouse mAbs. Coated bead populations are calibrated in terms of their ABC for monoclonal antibodies and therefore, each population has a specific level of antibody capture capacity via the Fc portion of mAbs. In other words, each calibration bead population binds a specific, standardized number of antibodies, thus mimicking the binding of specific monoclonal antibodies to targets on the surface of cells. A titration step is essential to ensure that saturating amounts of labeled mAb are used to stain the beads and cells.
Protocol 1 - QSC Microsphere Antibody Titration
Accurate determination of cellular receptor density requires that each bead’s binding sites are fully saturated with the antibody. For this reason, an antibody titration step is crucial to determine the optimal antibody concentration required to reach saturation for staining. A general titration involves the creation of a dilution series of the fluorophore-conjugated mAb (Figure 1), typically using the manufacturer’s recommended concentration as a starting point and choosing a range of dilutions higher/lower than this value. A selected level of QSC beads is used and beads are stained with the different dilutions of fluorophore-conjugated mAb (Figure 1). Stained QSC beads are then analyzed by flow cytometry to determine each dilution’s mean fluorescence intensity and data are used to create a scatter plot displaying the mean fluorescence intensity versus antibody concentration (Figure 2). The determined optimal antibody concentration is finally used to stain all subsequent QSC bead populations (excluding the blank) in order to create a standard curve, as well as to stain cell samples.
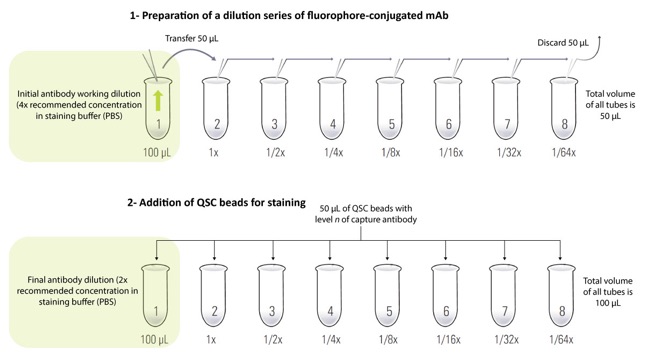
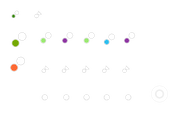
Figure 1: Sample setup scheme for the creation of a serial dilution of the fluorophore-conjugated mAb and staining of QSC beads. The aim is to perform an antibody titration and determine an optimal antibody concentration for the staining of QSC standards and cell samples.
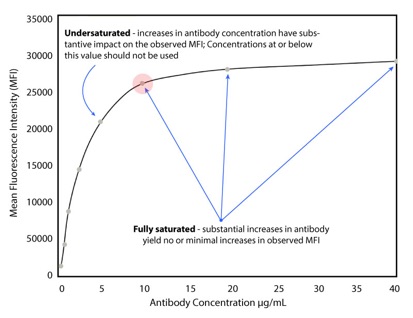
Figure 2: A dose-to-response curve relating the antibody concentration to the mean fluorescence intensity (MFI). Appropriate saturation appears to be reached at 10 μg/mL. This concentration is used in protocol 2 to stain the QSC standards and cell samples.
Protocol 2 - Analysis of Stained QSC Microspheres for Creating a Standard Curve
The four bead populations with increasing antibody capture capacity (Level 1 to 4, excluding the blank) are separately stained with fluorophore-conjugated mAbs at saturation levels (using optimal concentration determined by antibody titration in protocol 1) and subsequently analyzed by flow cytometry (Figure 3). Stained bead populations may be combined and run in a single tube or run individually. The blank population may be added to the stained populations or run individually. To ensure accurate and reproducible assignments, the five QSC bead populations, including the blank, are run in the same type of suspension medium, on the same instrument, at the same instrument settings, and on the same day as cell samples. Channel values for each bead population are recorded to establish a calibration curve associating the fluorescence channel value to the pre-assigned (standardized) ABC value of the beads. The channel values of cell samples stained with the same antibody are then read against the standard curve and the ABC value is assigned to each cell population (quantitation of the fluorescence signal from each cell population). If a monovalent antibody-to-surface receptor binding (1:1 binding ratio) is presumed, then the ABC value is equivalent to the total receptor density, which indicates the number of receptors expressed on the cell surface.

Figure 3: Schematic illustration of the procedure for staining and analyzing QSC standards by flow cytometry. The goal is to establish a standard curve, which is subsequently used for the determination of ABC and thereby receptor density of cell samples stained with the same fluorophore-conjugated mAb.
Explore The QuantumTM Simply Cellular® (QSC) kits for fluorescence quantitation
For more information on the protocols:
Protocols
Contact info

 This is an open access protocol distributed under the terms of the Creative Commons Attribution License, which permits unrestricted use, distribution, and reproduction in any medium, provided the original author and source are credited.